|
Author: Russell Gray I did a few quick analyses that may be beneficial to anyone partaking in the Python Bowl 2020 in Florida using open-source data queried from EDDMaPs database. 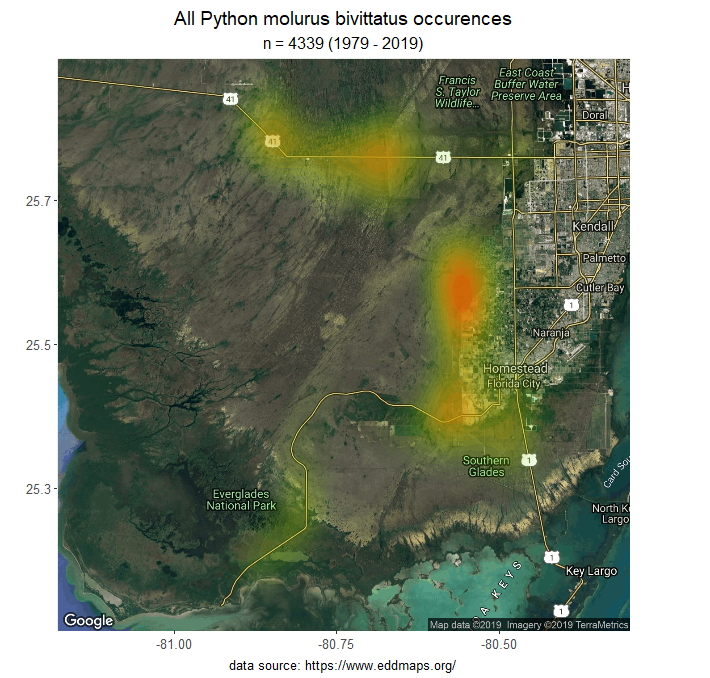 Figure 1. A density map showing hotspots for python captures using all available data. The largest density is location in the areas surrounding Quail Roost Dr. and SW 237th Ave. Other hotspots can be seen to the north on 41 (Tamiami trail) heading west, starting at the L-67 and ending around the northward bend. To the south, main park road of Everglades National Park approaching Flamingo. 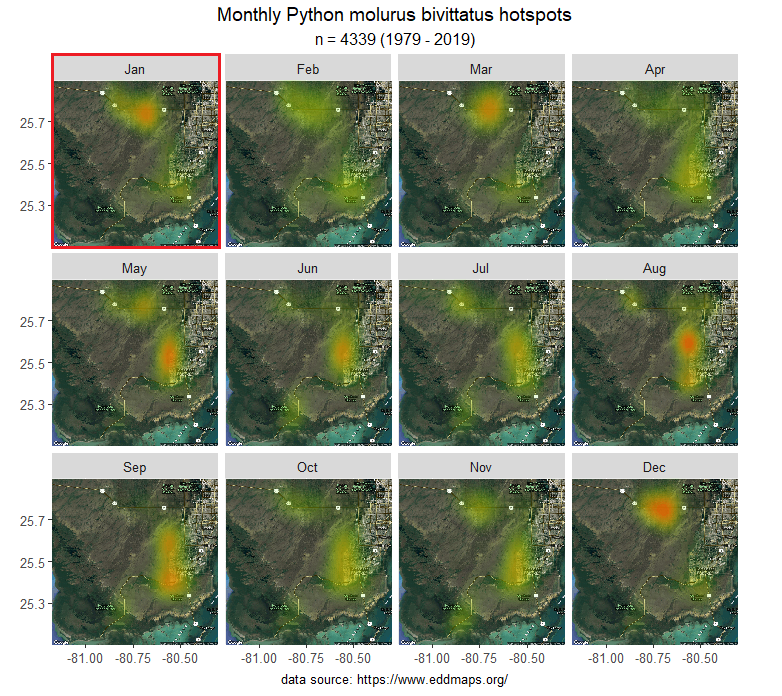 Figure 2. A monthly breakdown of data, this is much more prominent than the last time I made these maps, but you can see an almost distinctive migratory pattern. Whether this has to do with human effort or actual python migration I'm not exactly certain, but my working theory is that the elevation gradient of southern Florida (Figure 3., EPA 2019) causes the southern portions of South Florida to become dry during the colder months, and then begin flooding during the warmer months and the onset of the hurricane season. Pythons are semi-aquatic species, so water is an important part of their lives. 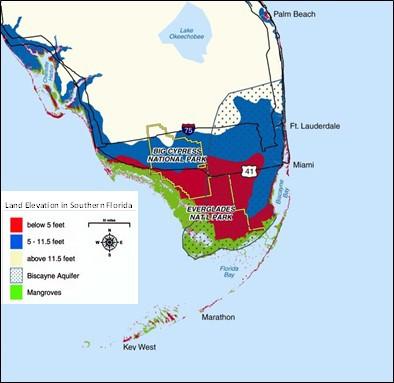 Figure 3. Elevation gradient of south Florida; map by the EPA, 2019 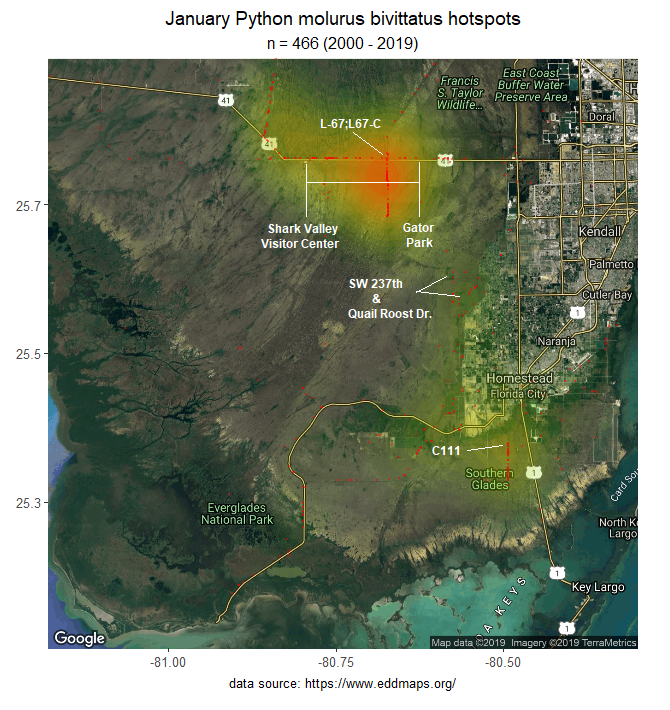 Figure 4. Zooming in on January (the month of the upcoming python challenge) we can see that historically, the northern hotspots are most prominent, this includes a large area between the Gator Park, and the Shark Valley Visitor Center, while the core area of activity is located around the L-67 intersection with Tamiami trail. To the south, there is some activity around the C-111 in Southern Glades, and a bit of activity around Quail Roost dr. and SW 237th as well. 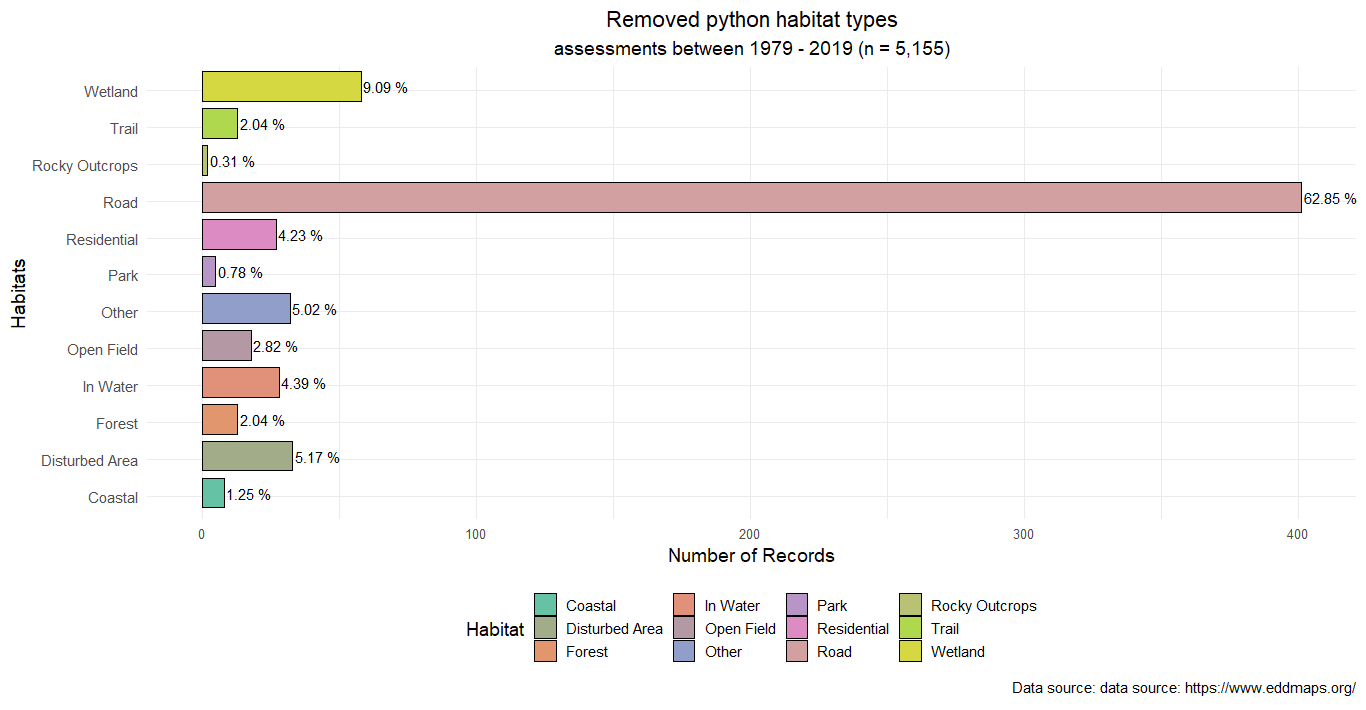 Figure 5. Habitats used based on removal locations (obviously biased towards roads, as that's where most of them are spotted during road cruising efforts). 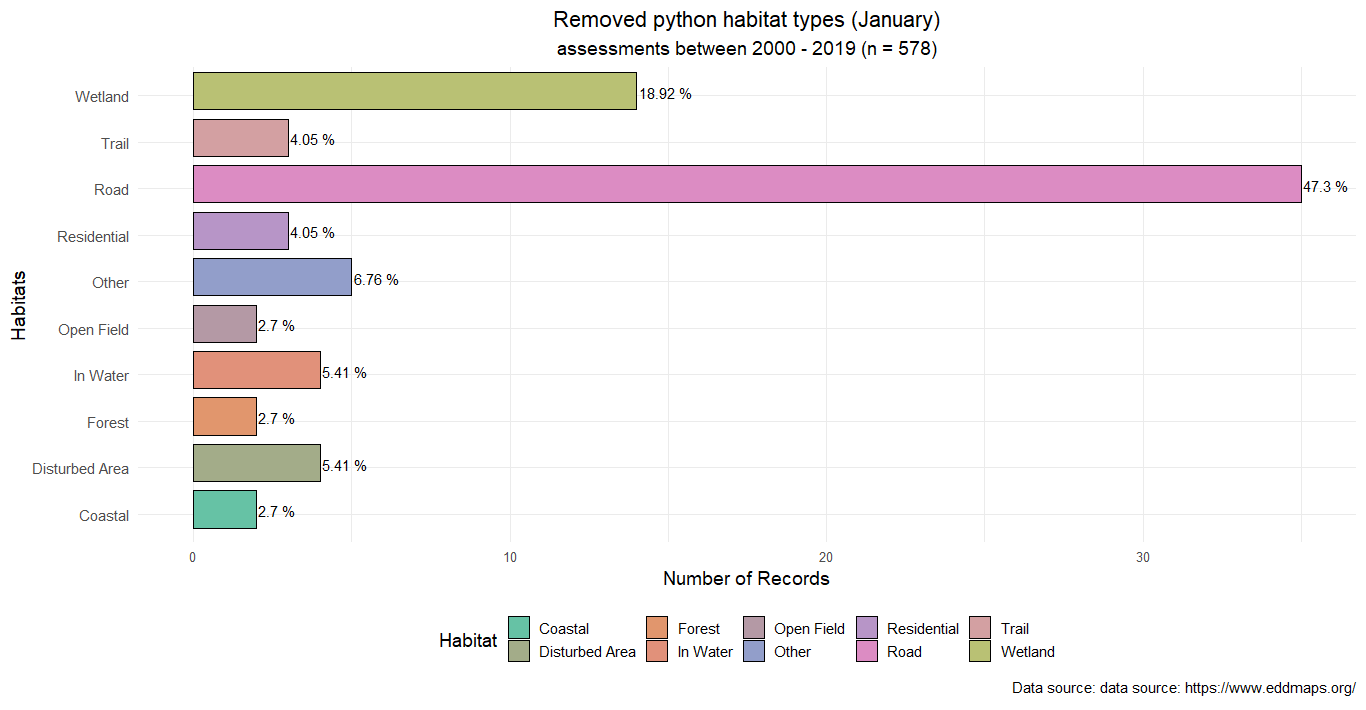 Figure 6. A subset of removal records from January of each year, again biased towards roads for obvious reasons.
I do have data on time and microclimate, but it isn't open source so I can't share the data. If someone from USGS, FWC, or SFWMD messages me with permission, I would be more than happy to include the data. #------------------------------------------------------- Feel free to share with your friends and colleagues who are thinking about registering. Florida is my home state, and although I love these animals with a passion, they have to go. Happy Hunting! For registry information and other details visit the python challenge page here: https://flpythonchallenge.org/participate/
0 Comments
Leave a Reply. |
AuthorRussell J. Gray Archives
April 2021
Categories |
 RSS Feed
